
Bifacial modules: a comprehensive guide on financial and technical performance of the next hot thing in solar
- Published by


26 Feb, 21 / UPDATED 24 Jan, 22
Even if bifacial technology has been present for as long as the monofacial technologies, bifacial solar modules have started to attract a lot of market attention in recent years due to higher efficiencies and lower levelized costs of electricity (LCOE). According to a report by Wood Mackenzie Power & Renewables, installed capacity grew from only 97 MW globally in 2016 to over 2,600 MW in 2018 and it is expected to reach 20,000 MW in 2024 accounting for 17% of the global PV module market in 2024. ITRPV (the International Technology Roadmap for Photovoltaic) has further predicted that the market share of such modules will increase by at least 35% by 2030. Data by Infolink expects global bifacial demand to reach 12GW in 2020.
Recent studies point out that the increasing interest for bifacial PV has aroused so much to predict a market share of 70% in 2030. According to data by RatedPower users in which bifacials modules use has doubled from 2020 to 2021 reaching a 57% of total simulations carried out, this prediction could be very well correct.
Current Industry Snapshot
The bifacial module market is growing rapidly due to several advantages that have made it competitive. Key characteristics are their design that allows the module to capture sunlight from both sides of the panel increasing the solar generation capacity up to 25% according to ArcVera Renewables depending on factors such as the albedo and the height. Their improved efficiency cell structures, increased durability and longevity has resulted in lower Balance of System (BOS) costs.
In terms of modules, the most classical and mostly used bifacial cell is nPERT, followed by HJT and bifacial PERCþ.
Key players operating in the global bifacial solar market include panels such as:
Canadian Solar: Biku
Jinko Solar: Swan or N-Type
JA Solar
LONGi: Hi-MO
Risen: HJT
LG: NeON 2
Prism Solar
Yingli: Panda
Lumos Solar: GSX
Silfab: SLG
Sunpreme: GxB
Trina Solar: DUOMAX


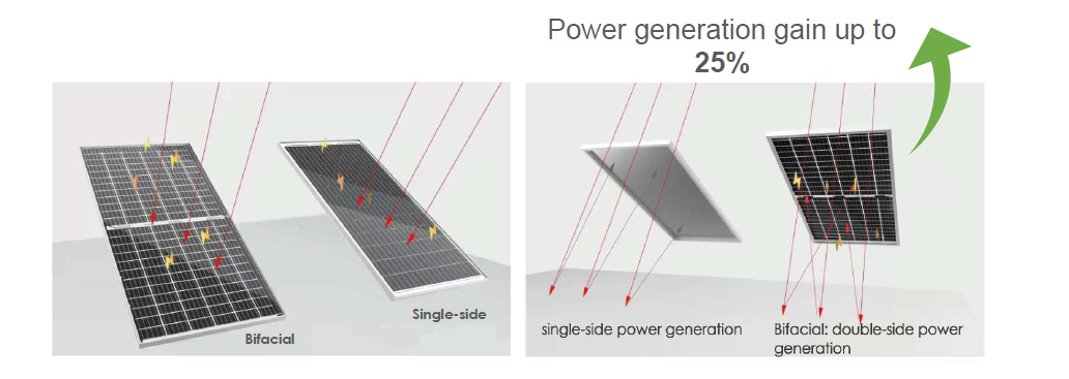
Bifacial gain (Source: Jinko)
Given the potential of the bifacial technologies, the main question is whether the industry will be able to overcome the same challenges that renewable energy technologies like wind and solar faced in the 2000s: standardization, bifacial system gain simulations and bankability.
Bifacial modules history
The bifacial PV history actually began with the very first solar cell processed at the Bell Labs in 1954. At first, bifaciality was much more expensive than standard module technologies and it was mainly used in the 70s for space applications. It wasn't until the beginning of this century when the first cost-effective bifacial panels entered the market and around 2012 when it arose industrial interest.
Solar Wind, PVGS, Yingli and bSolar were the first producers of standard p- and n-type bifacial solar cells with low-cost processes. They were followed by more complex units by LG electronics and Sunpreme.


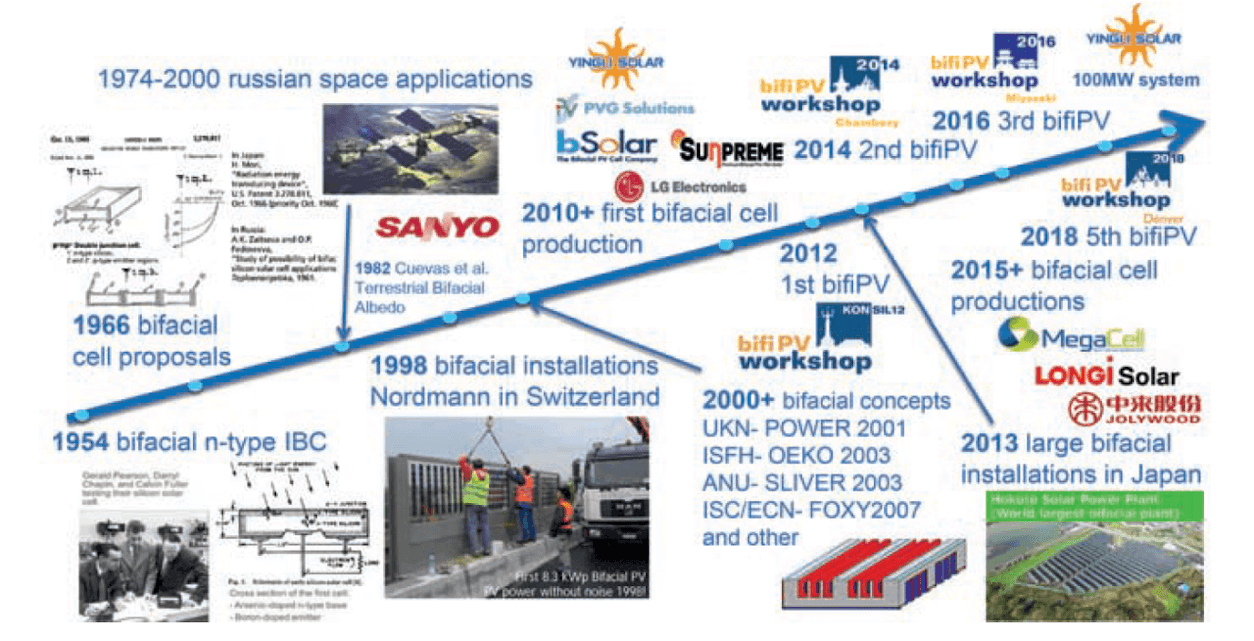
Bifacial History (Source: Bifacial Photovoltaics: technology, applications and economics. IET 2019)
Key bifacial market, by country
Taking into account data from Infolink up to 2019 most exports from China, bifacial largest market, came from emerging markets.
Furthermore, according to this study based on Chinese exports, the geographical distribution of overseas demand for bifacial modules (excluding China and the US) was concentrated in Egypt in the second half of 2018, but it became more widespread in 2019, expanding to countries like the UAE, Mexico, Brazil, Oman, Japan, El Salvador, Chile or Pakistan and the U.K., Denmark and the Netherlands in Europe.


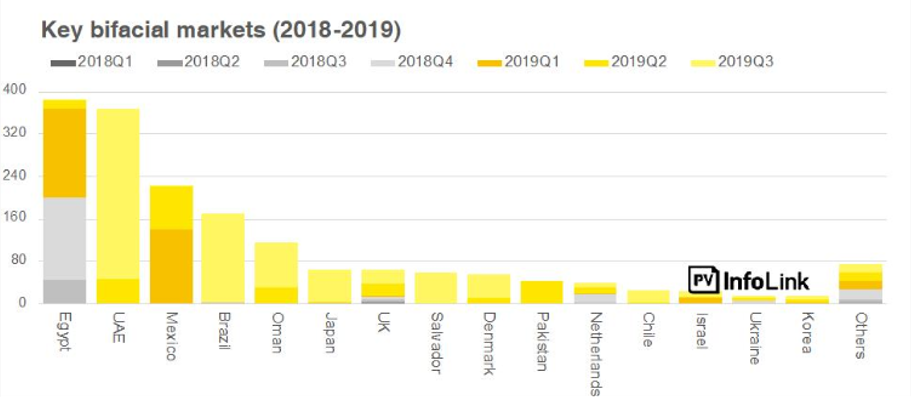
Key bifacial markets in MW (2018-2019) (Source: InfoLink)
In line with the IEEE Journal of Photovoltaics, there are different bifacial gains depending on the regions. These gains are also influenced directly by the albedo, the height and the latitude of the site.
The report on the "Global bifacial module market" by Woodmac, highlights China as the most developed country in the industry. However, a slower growth rate of 20% is expected due to the new subsidy-free system. Another important market, however irregular, has been the U.S. market due to the on and off exemption of the
Section 201 Tariff. This sway was led by the module supply shortage and the high module prices. In October 2020, then-President Donald Trump increased the tariff rate from 15% to 18% for its fourth year, revoked the exclusion for bifacial panels and directed the ITC to consider extending the tariffs beyond their scheduled expiry on 6 February 2022.
The US Solar Energy Industry Association (SEIA) report, which opposes the tariffs, found that the US solar industry had 62,000 fewer jobs in 2017-2021 due to the tariffs, $19 billion in lost investment, and 10.5GW of lost solar deployment. Prices for solar panels are 43-57% higher than the international average, raising solar energy prices for customers and weighing on demand.
Additionally, the Middle East, too, is expected to see a significant level of bifacial adoption due to the region’s desert terrain and higher albedo.
Northern Europe will also continue to see bifacial adoption due to the region's high latitude that influences directly on its efficiency.
Finally, Australia is also expected to introduce bifacial modules in their photovoltaic energy mix due to its bifacial-friendly desert terrain and the high electricity tariffs that have driven solar growth.
In accordance with data from both studies, Infolink and the Woodmac report, on a recent webinar, Longi agreed that the countries that were seeing the greatest deployment of power plants with bifacial modules were China, Chile, Mexico and the Middle East.


Forecast of Global Annual Installed Bifacial Solar 2019-2024E (Source: Wood Mackenzie Power & Renewables)
LCOE and advantages of bifacial solar systems
The driving forces behind the growth of bifacials differ from regions, but one unifying factor is the growing affordability of bifacial modules. As outlined by the WoodMac report, the study found out that the production cost differential between bifacial mono PERC and monofacial mono PERC modules are now approximately $0.50. On another note, based on another study by NREL on LCOE Analysis on various sites in the United States, the report situated real LCOE (USD/MWh) for bifacials to be around 25-45 $/MWh depending on the location of the site, similarly to the LCOE of monofacials. The NREL study comes to the conclusion therefore that currently, LCOE of bifacial systems is competitive with monofacial systems, even with initial cost added of 5-6 ¢/W.
Other sources such as the White Paper on Bifacial Modules by Burns & McDonnell state that LCOE analysis for bifacial modules is still in its early stages, with the development of uniform measurement standards still in process. However, the improved production and performance over the systems’ lives due to the energy gains and improved durability of bifacial PV systems, is a major step forward toward the ultimate goal of a lower LCOE.
Additionally, according to BNEF, 80% of industry experts believe that the technology is now bankable. As Dana Albella from Longi Solar stated in a Energyear webinar, “Bifacial technology not only is bankable, but is a technology that has arrived to stay”.
Furthermore, if we take a look into the data extracted from almost 80.000 simulations carried out in RatedPower in the past 2 years, the global trend highlights the use of bifacial modules in 2021 as around 57% of designs were carried out with this configuration (total of almost 6.500GW). When compared to data gathered from 2020, there is a clear global trend that shows an increase use of bifacial modules with a growth of almost a 100% reaching a total of 57% of simulations done with bifacials (from 30% done in 2020).


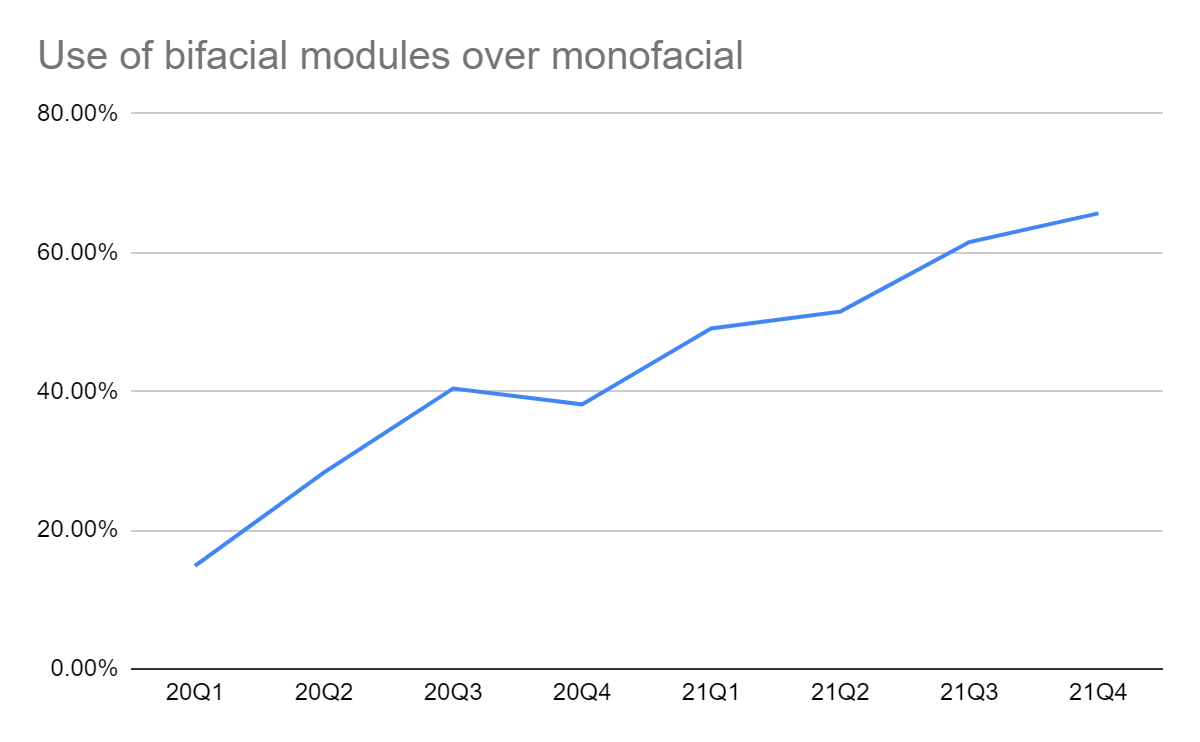
More than half of the designs done in RatedPower in 2021 were carried out with bifacial modules. Almost a 100% increase of use in comparison to 2020.


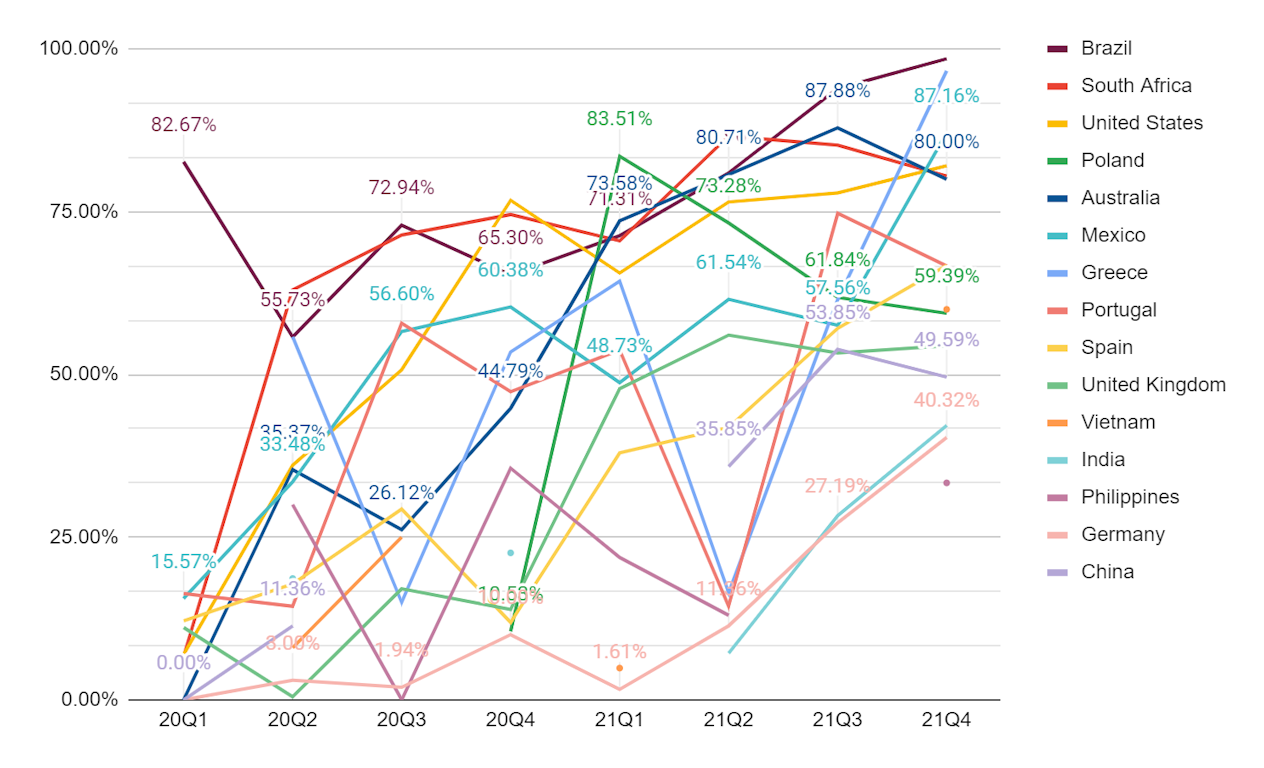
Percentage use of bifacial modules over monofacial by country. Source: RatedPower
Download our “Solar Research Study” to find out more about RatedPower statistics and experts opinions.
Key factors affecting performance and energy yield of bifacial modules
What are the technical aspects that affect bifacial performance and the reason why simulations using bifacial technology in RatedPower have reached almost 3 TW in 2 years (44% of total simulations).
Difference between monofacial cells and bifacial cells
While normal photovoltaic cells have a full-area aluminum rear contact and an opaque back surface field, the rear side of bifacial cells is only partially covered with metallization. Although this rear side is not as efficient as the front side, according to ArcVera Renewables, bifacial technology allows an average of energy production gain of between 3% to 10% and up to 30% depending on factors such as the albedo, the elevated height of the structure and the Ground Cover Ratio (GCR).


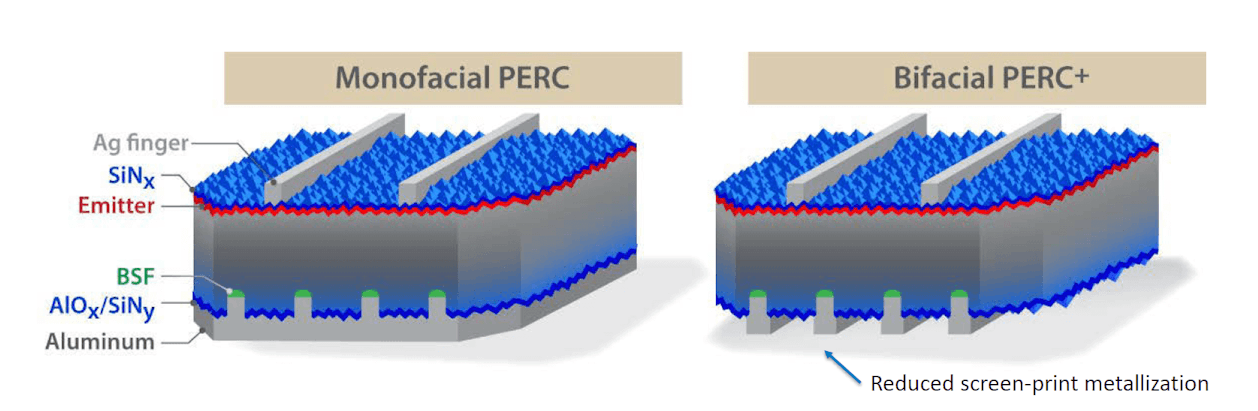
Monofacial and bifacial cells (Source: T. Dullweberet al., “PERC+: Industrial PERC solar cells with rear Al grid enabling bifaciality and reduced Al paste consumption,” Prog. Photovolt: Res. Appl. (2015))
Additionally, it is important to note that converting a production line from monofacial PERC cells to bifacial PERC cells requires virtually no additional costs or production-line modifications; but just a change on the screen layout of the Al screen-print. This fact, explained in the book “Bifacial Photovoltaics”, further shows the potential of this technology and how easy it could be adopted.
Required design parameters and effect on production values
The solar industry is in constant evolution.The use of bifacials is one of the most recent innovations the industry adoptions and as such, several reports study this phenomenon. In these studies energy yield efficiencies and economic viability of projects are calculated by taking into account a series of different parameters.
When developing solar plants with bifacial modules we can differentiate at least 7 key factors that affect the energy yield. These are the irradiance factors, the module efficiency, the ground albedo, the tilt angle, the elevated height to the ground of the structure, the GCR and the array shading.


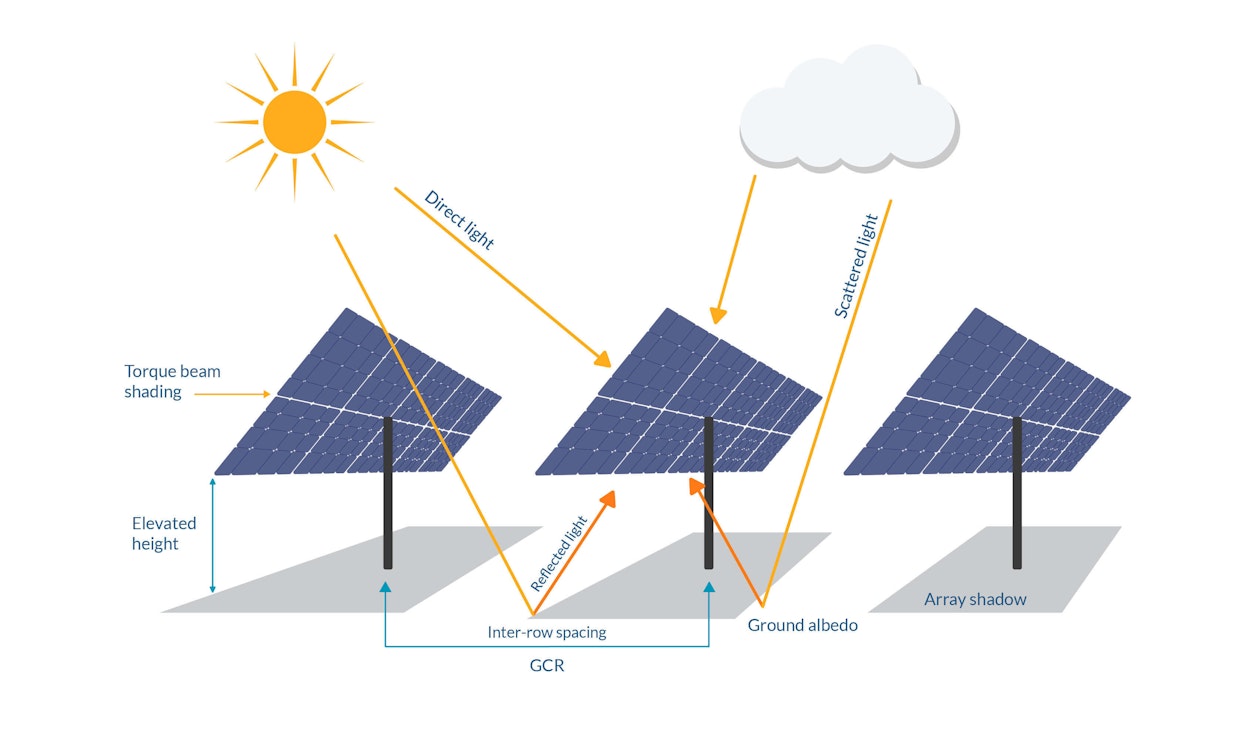
Key factors that affect bifacial efficiency (Source: pvDesign)
In terms of irradiance received by the module, bifacial gain is directly proportional to the direct sunlight, scattered light and reflected light received by the rear side. Albedo, ground coverage and mounting characteristics also have an impact in these calculations.
Moreover, bifacial gain is also affected by the module quality and other factors, including:
Albedo
Height to the ground
Ground Cover ratio
Potential in world regions
Albedo
Bifacial modules take advantage of the light reflected from the ground and received by the rear side. The proportion of that light reflected off the ground is known as albedo and it is directly related to the type of soil. The higher the albedo, the higher the production gain. The following table shows a collection of albedo factors for different types of surfaces.


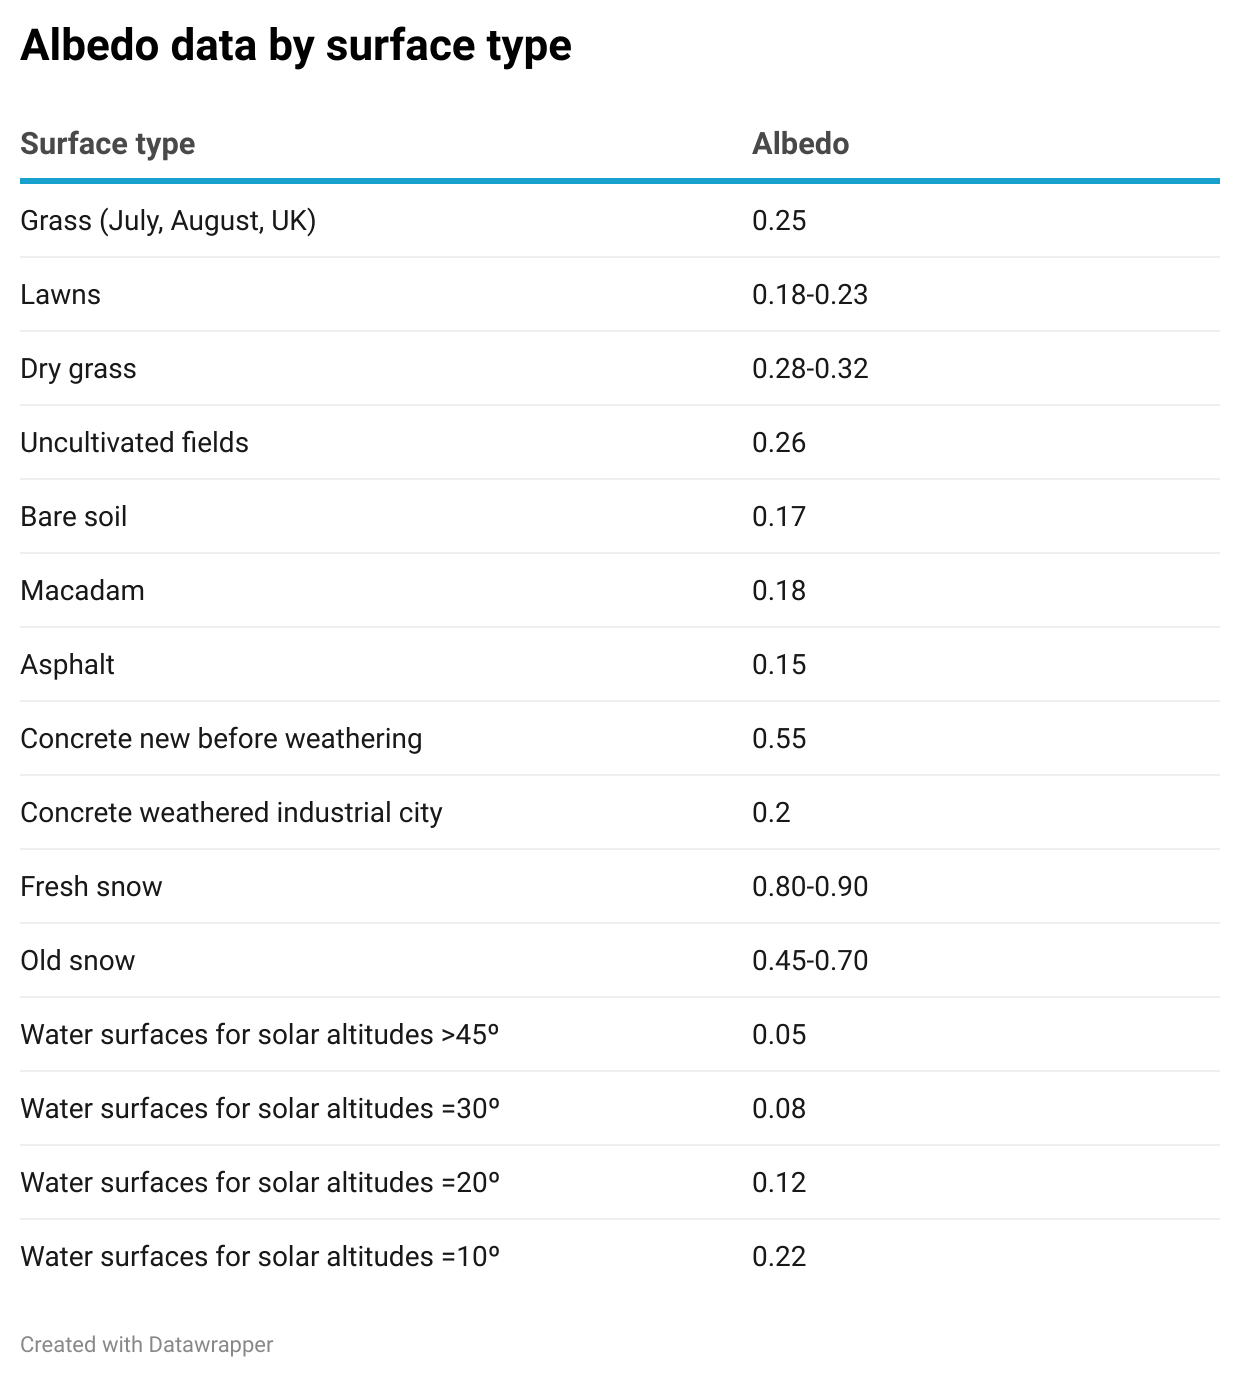
Albedo data by surface type (Source: Practical Handbook of Photovoltaics: Fundamentals and Applications)
As an example, given a snow-covered ground in Iceland, with an albedo factor of approximately 0.68 (according to satelital data), the estimated bifacial gain would be around 16.55% according to RatedPower results. On the other hand, a sand-covered site in California with an estimated albedo of 0.36 would result in a 7.3% bifacial gain.
These estimations have been carried out for a scenario of fixed structures with a 50% GCR and a bifaciality factor of 75%.
Understanding how bifacial gain and energy yield depend on the albedo highlights the importance of adapting the ground and maintaining it in order to ensure minimal mismatch losses.
Height to the ground
The height to the ground is another key factor to take into account when designing and simulating solar plants with bifacial technology. Increasing the module height improves the backside irradiance uniformity, therefore increasing bifacial power gain due to increased perception of ground-reflected light on the rear side. However, increasing the height could also lead to increased wind loads on the modules.
According to studies from Longi Solar and Waree, the height should be higher than 1m. The suggested optimal is 1.2-1.3 for the best yield results.
This notion would be reinforced by the simulations obtained in RatedPower. The conditions of these simulations are further explained and analysed below.


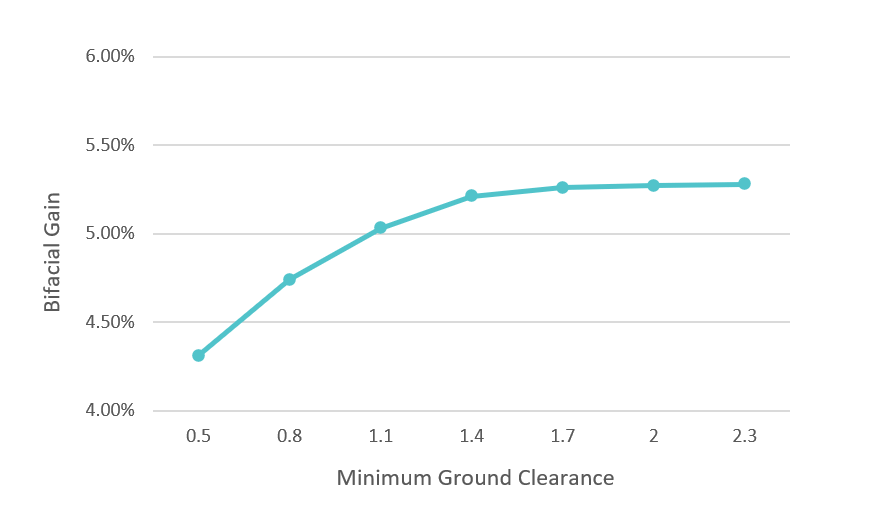
RatedPower effect of height of the module (Ground Clearance) on a bifacial gain Source: RatedPower
Ground Cover ratio
GCR is the ratio between the area occupied by PV modules and the total available area. This ratio is directly related to the pitch distance, the inter-row spacing between tables of PV modules.
Decreasing the GCR implies a greater pitch distance, thus increased energy production. However, this also has an effect on the power plant area. The suggested GCR for optimised results according to Waaree and RatedPower would be around 40-50%. The conditions of these simulations are again further explained below.


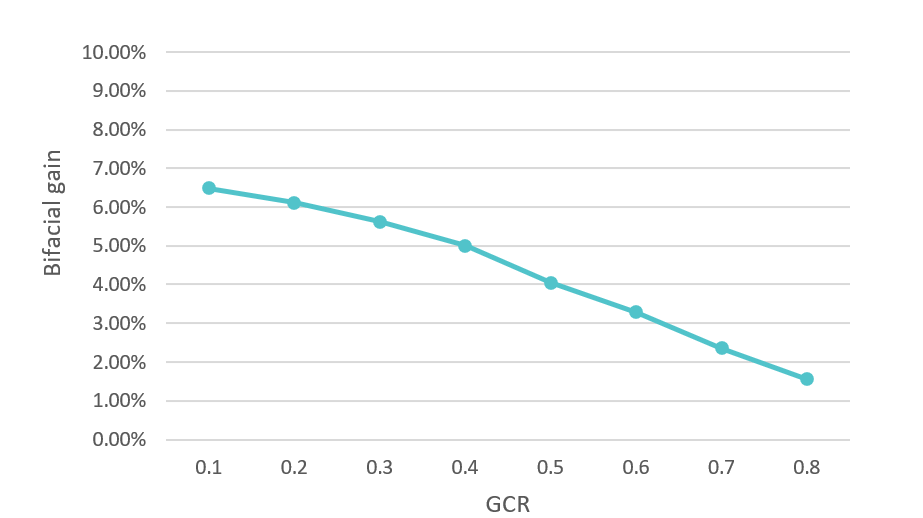
RatedPower effect of Ground Cover Ratio (GCR) on bifacial gain (Source: pvDesign)
World region
A recent article on bifacial project’s LCOE published on Joule found that bifacial modules paired with single-axis trackers achieve lower LCOE in most locations (93,1% of the world) when compared to bifacial modules mounted on dual-axis trackers. The latter would generally show a boost in energy yield of around 35 - 40%.
To obtain the above conclusions, the paper mentioned explores the cost effectiveness of bifacial versus monofacial PV plants with different structures (fixed-tilt, 1T and 2T) worldwide and compares the results obtained.


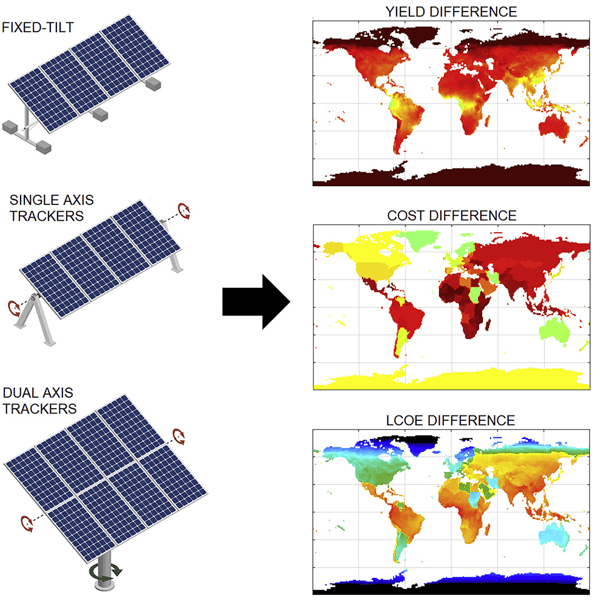
Summary of the analysis of yield, cost and LCOE difference with bifacial modules. (Source: Joule ) we recommend to visit the source to better understand the different heatmaps.
On the one hand, in terms of energy yield potential, with the same mounting structure, using bifacial configurations outperforms monofacial modules with improvements higher than 50% average difference in high latitudes (±60°), highlighting the advantage of using bifacial tracking in these regions.


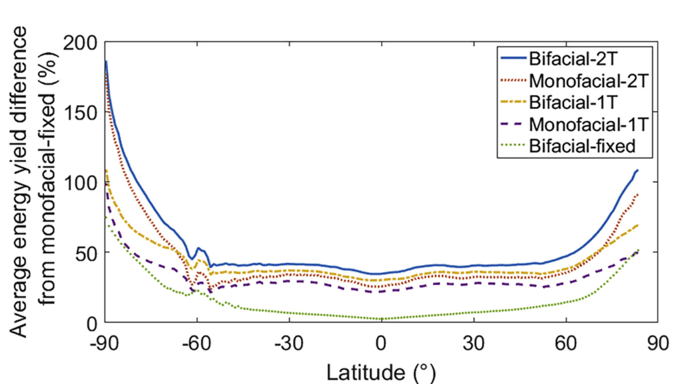
Average energy yield difference depending on latitude. (Source Global Techno-Economic Performance of Bifacial and Tracking Photovoltaic Systems)
This information is supported by the study “Bifacial Photovoltaics” which states that rear irradiance gain can vary from 1% in equatorial regions to 40% in high latitude areas for fixed-tilt ground mounted systems.


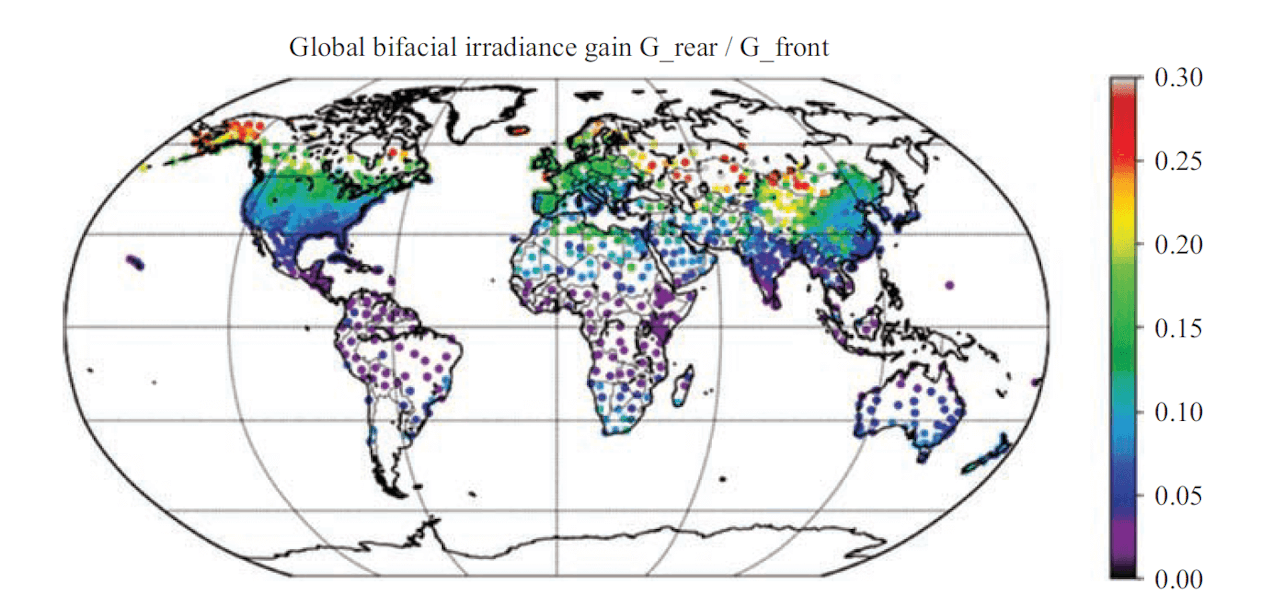
Global Bifacial Irradiance Gain. (Source: J. Libal and R. Kopecek, Eds., Bifacial Photovoltaics: Technology, applications, and economics)
Structures
On the other hand, when studying the cost difference of the structures, the article reveals that overall cost of bifacial-fixed systems is slightly higher than the one from its monofacial counterpart because of the higher inverter, installation, and O&M costs.
To conclude, the article combines energy yield and cost difference to study the LCOE of the different configurations and technologies. As a result, bifacial installations with single-axis trackers reach the lowest LCOE almost everywhere, 93.1% of the total land area. These findings are explained by the fact that one-axis tracker systems generate comparably high yields, while requiring only marginally higher cost.
On the other hand, although two-axis tracker systems in general generate the highest yield, their considerably more expensive mounting structure outweighs the benefits in energy generation.
Other calculations such as the ones in the study “Optimization and performance of bifacial solar modules” predict that for a low ground albedo of 0.25 corresponding to vegetation/soil, ground-mounted bifacial solar modules can only achieve bifacial gain up to 10% relative to their monofacial counterpart across the entire world (except for the Arctic and Antarctic regions where it would be higher).
On the other hand, the report “Modelling of Single-Axis Tracking Gain for Bifacial PV Systems” calculates that gains in terms of specific production (kWh/kWp) can be estimated to be between 5% and 15% for “normal” ground albedos (0.2-0.5) for fixed-tilt structures, and between 3% and 11% for single axis solar trackers in comparison to standard PV plants.
To compare the results obtained by the different studies, we have simulated our own analysis with RatedPower using the following parameters:
Commercial module 425 W STC, 1500V, and a 75% of bifaciality factor.
GCR of 50% .
Ground Clearance (height to the ground) of 1.10m.
Fixed structures and trackers.
Different locations (California and Iceland) and albedos (normal satellital albedo 0.21, optimal dessert conditions 0.36 and snow satellital conditions of 0.68 in Iceland).
When comparing fixed structures with trackers in California, our analysis found out that fixed structures obtain a 6% higher bifacial gain compared to trackers (4.45% to 4.17% respectively).
In scenarios with higher production albedos and latitudes such as Iceland, this percentage increases to 30% improved bifacial gain (16.55% to 12.65%).
In terms of specific production kWh/kWp, trackers outperform fixed structures resulting in 12.5% and 16.2% higher specific production kWh/kWp in albedo ratios of 0.21 and 0.68 respectively.
RatedPower simulations obtained bifacial gains up to 10%, with better results in high-albedo scenarios (up to 16%). Furthermore, fixed structures were found to obtain higher bifacial gains than single-axis trackers (using the same GCR), but still lower yield specific production than trackers.
Outlook and conclusions
Various sources report that the bifacial market has been growing beyond expectations in the last couple of years and forecasts ought to be remarkable.
We do not only see this in market expectations, but also in the designs made by RatedPower users which have almost doubled bifacial use in comparison to last year.
The global bifacial solar installations are estimated to reach in 2024 to 20 GW increasing significantly the size of the bifacial market to date. Accordingly, looking at bifacial module shipments of the top module manufacturers, Solargiga, Longi, JA Solar, Trina, Jinko, and Canadian Solar, total bifacial module shipments in 2018 reached 5 GW exceeding WoodMac predictions of 2.6 GW in the same year.
In terms of market share, according to the International Roadmap of Photovoltaic (ITRPV), bifacial technology implementation is expected to grow from 12% in 2019 to nearly 60% of total global installations by 2029.


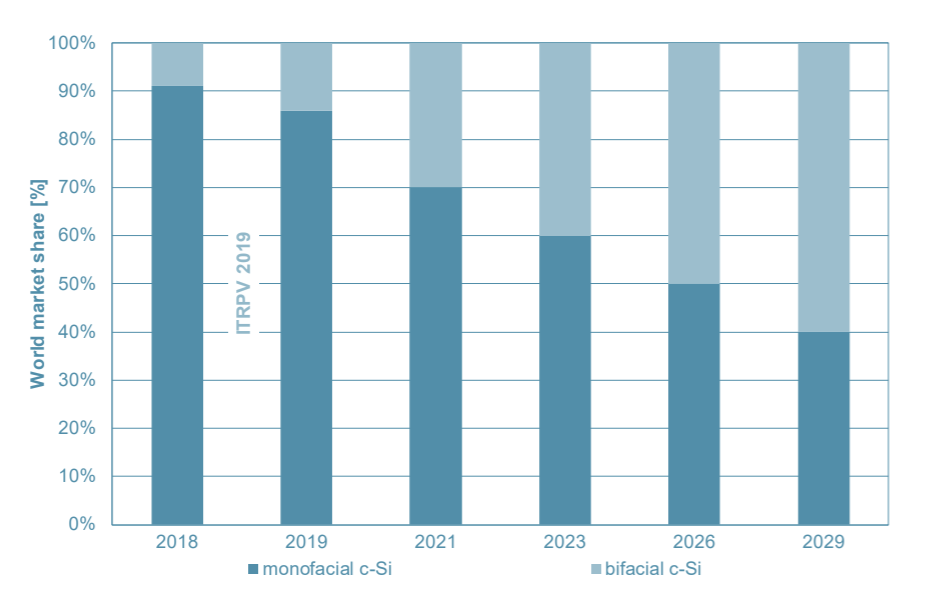
Bifacial technology forecast market share (Source: IRTV Maturity Report 2019)
“Although bifacial technology may cost $0.05/W more to install than a monofacial PV system, a conservative 10% bifacial gain easily outweighs the risk”
Scott Stephens
All in all, there are several studies that already prove important bifacial gains and increasing affordability with respect to current monofacial technologies.
There is no doubt that the industry will keep seeing new solar plant developments with this technology as well as simulation softwares to estimate its output.
In terms of RatedPower simulations with bifacials, since its introduction in 2019, there have been more than 350000 simulations (155.59 GW) which accounts to almost 3 TW. This represents more than 44% of total GW simulated in RatedPower (57% only in 2021).
Due to the fact that RatedPower is used in more than 160 countries in 5 continents, these numbers are a perfect worldwide snapshot of what is really happening concerning the adoption of bifacials and the industry preferences.
What you should do now
Whenever you’re ready, here are 4 ways we can help you grow your solar business and reduce LCOE of your PV plants.
- Get hands-on with a free RatedPower self-service guided tour. If you’d like to learn the ins and outs of how top photovoltaic software can help your engineering team, go ahead and request your free demo. One of our solar experts will understand your current design and engineering workflows, and then suggest practical tips on how to speed up them though the right tool.
- Let's get physical, physical! Learn the latest on renewable energy and PV in the second edition of Pulse, our annual get-together full of technical workshops, inspiring talks from energy leaders and tons of networking. Learn more.
- If you’d like to learn insights, ideas and inspiration for the low-carbon energy transition for free, go to our blog or visit our resources section, where you can download guides, templates and checklists solar successful pros use.
- If you’d like to work with other passionate experts on our team, or learn more about our purpose and corporate values, then see our Careers page.
- If you know another solar designer, developer or engineer who’d enjoy reading this page, share it with them via email, LinkedIn or Twitter.
Related posts
Searching results